I'm not committing to coming back to regular updates, but here's the
output of a model I've put together for the 2015 elections. This runs
2000 individually simulated elections, using minor random variations on
data from current polling. That way we can see what the possibility
space for the election results look like.
Here we see that in the simulated election, both the Conservatives and
Labour don't have their most likely positions in place to get a majority
of seats. But we can notice that Labour have a second small peak closer
to the majority needed, so may well be much better placed than they
look, and it's not entirely ruled out that they could get a majority.
However, a majority is still unlikely.
This result comes about because my model is very pessimistic for labour
at the moment, as the underlying trends look weak after being disrupted
by conference season.
A few tweaks to the internals of the simulation (and this time ensuring
all 2000 runs are put into the graph, not just 1000 of them) and here's
another seat spread...
As you can see, the most common result puts Labour short of a majority.
But again we see a second peak just after majority, that suggests a
significant chance of a majority. The non-uniform nature of the
distribution of seats does mean this kind of quirk can pop-up.
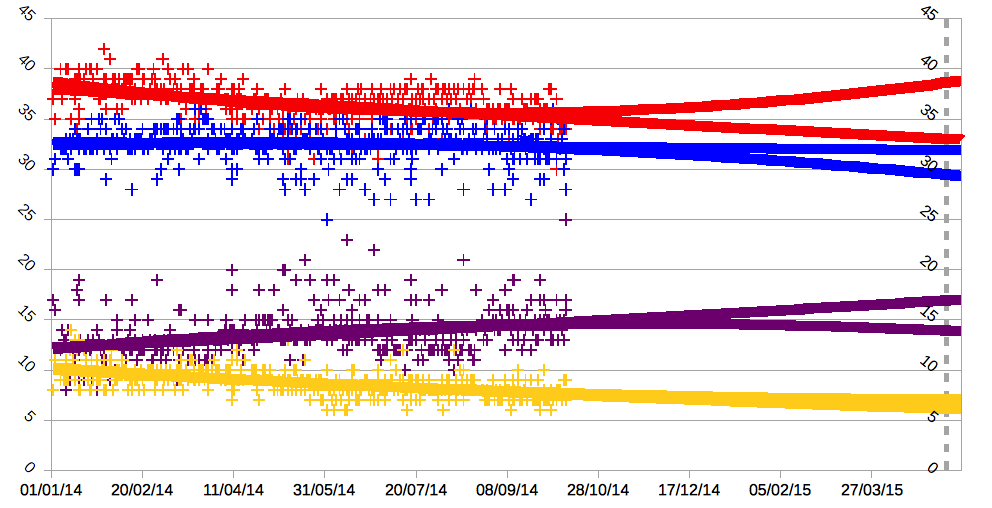
And here's a somewhat familiar trend graph from recent polling, which
shows what rough area you could expect the vote shares to be in if trends continued. It's
an important caveat that trends almost never continue without some
change. It's somewhat difficult to identify if election polling follows a
power or a polynomial trend, and some times a party's path towards
election day can look like one or the other. So this graph has a Y split
showing how the two different types of trend prediction diverge.
You'll note that the trend for UKIP looks pretty good for them, but I'm
the model isn't showing them winning any seats. Which you might think is
odd, because UKIP now have an MP from a by-election. There's a simple
reason for this, the model doesn't know about by-elections. In my
previous model, I attempted to use by-elections as a data point, this
was a mistake. By-elections do not have a strong link to
general-elections, and there's strong historical precedent for not
applying swing calculations to a seat's by-election result, including
many cases where a change due to by-election was over-turned at the
following general election. As such, the seat predictions work based on
how the seat was at the 2010 general election. I think this will better
model a national general election, rather than using data from
by-elections where an entire party and media circus is focused on a
single seat.
A little more tweaking to the internals, and adding in today's YouGov.
This also gives a rough prediction of
the probability of either Conservative or Labour having a majority in
the House of Commons, currently on 39% for Labour and 2% for
Conservative.
Known problems with the model so far: SNP seat projections are
problematic, and probably benefiting Labour a fair amount, but this is
hard to fix without special casing SNP marginals. UKIP seats don't
include any wins in ByElections, again this would require special casing
to try and predict if they will retain them at the General Election.
The Polynomal trend line can not be used in the election simulation for
technical reasons, so Labour's vote share is probably a little low. This
probably compensates for phantom gains from the SNP now, but probably
not closer to the election. However, this is a tiny number of seats
being predicted, and within variation of any close result.
Recent fixes to the model: Standard distribution now used for the
election simulation, rather than a flat random variation. Reduced
over-confidence that the trends are correct. Introduced a Consumer
Confidence rating based limit to the weight of "return to mean"
tightening of the result.
from


